Methodology
How LookFlex measures your face
LookFlex shows its work. This page explains, step by step, how a selfie becomes sixteen measurements, a skin read and a score, how precise each number is, where the numbers come from, and where they are weak.
Updated · Written by the LookFlex team · Not independently audited
On this page
The short version
A LookFlex scan has five layers, and each one is built to be checked rather than trusted:
- Geometry on your device. A face-landmark model finds 478 points on your face. From them LookFlex calculates 16 proportions, bilateral symmetry and a face-shape probability for each of seven shapes.
- Skin on your device. Pixels inside landmark-defined zones are analysed relative to your own skin, designed so that the result does not depend on how light or dark your skin is.
- A margin on every number. Each photo is measured three times, and every reading gets a 95% measurement margin. A change between two scans counts only when it is bigger than both margins combined.
- Scores. Measurements are compared with scoring ranges, combined with fixed, published weights into six sub-scores, then into your Glow Score. Potential is the same formula run on one defined scenario.
- An optional AI read. When enabled, an AI model looks at what geometry cannot (skin condition, hair, grooming, lighting) and can nudge scores by a small, bounded amount. It can never overrule a measurement.
We also tell you what is weak: the ranges and margins were measured on a small set of AI-generated faces and are still being validated on real photographs. The calibration section, the precision section and the limitations section spell this out.
Step 1: Finding 478 landmarks on your device
The first step uses a face-landmark model from the open-source MediaPipe project. LookFlex hosts the model file itself and runs it on your iPhone using WebAssembly, on your graphics chip when one is available and on the processor otherwise. Because it runs locally, your photo does not leave your device for this step.
The model returns 478 points in three dimensions: the outlines of the face, eyes, brows, nose and lips, the iris centres and the contour of the jaw. The published research behind this kind of model describes a 468-point face mesh estimated from a single ordinary camera in real time on a phone (Kartynnik et al., 2019); the version LookFlex runs adds ten iris points. A few of these points carry most of the weight, and the page for each measurement lists the exact ones it reads.
The capture check
Before any measurement is trusted, LookFlex checks the photo itself and may ask for a retake. It looks for:
- Exactly one clear face, large enough and roughly centred.
- Enough light, without clipping, harsh one-sided shadow or glare.
- A sharp image of adequate resolution.
- A head that is not turned, tilted or pitched too far, and an expression that is close to neutral.
Every light check is designed to be fair across skin tones. Exposure is judged from highlights, the whites of the eyes and clipping, never from how dark your skin is. In the live camera, the same checks run roughly 10 to 15 times a second to guide you into position.
Step 2: Correcting head pose and averaging with a mirror
Head pose correction
A turned or nodding head changes every ratio on a flat photo. LookFlex first fits a reference 3D face to your landmarks (a similarity fit, using the rigid upper face so that a smile or open mouth does not disturb it) to estimate your yaw, pitch and roll. When the fit is reliable, the points are rotated back to a frontal view. Roll is always corrected by levelling the line between your pupils.
Pose is also used to set confidence. Once your head is more than about three degrees off straight, the confidence of the affected measurements starts to fall, and it falls faster for vertical measures when the head is pitched. If the 3D fit is not trustworthy, the penalty doubles.
Mirror averaging
Landmark models are not perfectly mirror-symmetric: a photo and its mirror image can give slightly different ratios. LookFlex therefore also detects your face on a mirrored copy of the photo, maps the points back, and averages the two. Real asymmetry survives because both estimates describe the same physical points, while part of the detection noise averages out. As a bonus, a photo and its mirror image give identical results.
Step 3: The 16 measurements
These are the sixteen measurements. Each links to a page that explains it in plain words, shows the landmarks it reads, gives its typical range and margin, and lists what changes it. The ranges below are the scoring ranges the app uses: a reading inside its range earns a closeness score of 100. They are in the units of LookFlex's face model.
| Measurement | What it compares | Men | Women |
|---|---|---|---|
| Canthal tilt | The angle from your inner to outer eye corner. | +2.0° to +7.0° | +3.5° to +8.5° |
| Eye spacing | The gap between your eyes compared with the width of one eye, the classic 'one eye apart' guide. | 1.18–1.36 | Same |
| Eye shape | How open your eyes are relative to their width. | 0.22–0.30 | 0.24–0.32 |
| Brow position | How high your brows sit above your eyes, relative to your eye spacing. | 0.145–0.195 | 0.185–0.250 |
| Eye-to-face width | Your pupil distance as a share of face width. | 0.435–0.475 | Same |
| Face width-to-height | Face width compared with mid-face height (brows to upper lip). | 1.82–2.00 | 1.74–1.88 |
| Midface ratio | Pupil distance compared with the height from the pupils to the upper lip. | 0.98–1.09 | Same |
| Facial thirds | Your middle third (brows to nose base) compared with your lower third (nose base to chin); the hairline isn't measured. | 0.85–0.98 | 0.92–1.04 |
| Face length-to-width | How long your face is relative to its width (hairline excluded). | 1.14–1.25 | 1.13–1.23 |
| Jaw width | Jaw width at the angles compared with cheek width. | 0.885–0.940 | 0.865–0.905 |
| Chin-to-philtrum | Chin height compared with the space between nose and upper lip. | 2.40–3.00 | 2.30–2.95 |
| Jaw definition | How crisp your jawline reads: the corner angle of the jaw plus the light-and-shadow edge under it. | 63+ | 55+ |
| Cheekbone prominence | How much your cheekbones stand out: the taper below them and the shadow they cast. | 58+ | Same |
| Nose width | Nose width at the base compared with the gap between your eyes. | 1.20–1.32 | 1.14–1.27 |
| Mouth-to-nose width | Mouth width compared with nose width. | 1.28–1.46 | 1.36–1.55 |
| Lip balance | Lower-lip height compared with upper-lip height. | 1.40–2.00 | Same |
From a measurement to a score
Each measurement gets a closeness score from 0 to 100. Inside the scoring range it is 100. Outside, it falls along a smooth curve with no cliff at the edge, with a width tuned to each measure's natural spread. A couple of measures fall away more slowly in the direction conventions prefer. The closeness score also sets the reading's label: inside the range, close to it (75 or more), further from it (50 or more) or well outside it.
Each measurement also carries a confidence value. It starts at a level set per measure (roughly 45% to 90%), then falls with head-pose error and with poor capture quality, and it sets how much that measurement counts toward your sub-scores. Confidence is separate from the measurement margin described below, which is what tells you how far a reading can move between photos.
Face shape
Face shape uses four of the ratios (length to width, forehead to cheekbones, jaw to cheekbones and chin to jaw). Each is compared with a reference average and spread, and the result is scored against a profile for each of the seven shapes. LookFlex reports a probability for all seven, a confidence, and a blend such as Oval–Round when the top two are within 8 percentage points. Face-shape categories are a styling convention rather than a research finding. See the face shape guides for the profiles.
How the ranges were calibrated
A range is only as good as its anchor. Here is exactly how ours were built, including the weak parts.
- Anchored on a reference set. Each range is centred on 45 adult faces run through this same engine (20 male, 24 female and 1 other). The set's median defines what is typical for each measure, and its middle half (the 25th to 75th percentile) is what LookFlex calls the typical range. For a few measures the scoring range leans from the median toward the direction styling convention prefers, such as a positive canthal tilt or a relatively narrower nose. The research behind those leans is thin: for canthal tilt, one small photo-editing study (Bashour & Geist, 2007), and for nose width we found no study that establishes a preferred value. Each measurement page carries an evidence label that says so. It is a lean, never a threshold of worth.
- Sex-specific where it matters. Some proportions differ on average between sexes and conventions lean differently for each, so those use separate male and female ranges. Others use one range. If you choose Other or prefer not to say, LookFlex blends the two.
- In the face model's units. Real detections differ systematically from textbook anthropometry. For example, the nostril points sit wider than the true nostrils and the eye corners sit inside the visible corners. Ranges are therefore set in the mesh's own units, and a mesh ratio will not match a number from a paper or a tape measure.
- Checked against the same set. We tuned the scoring ranges so that most faces in the set score well, every measure had at least 15% of faces inside its range, and no measure marked more than 15% as clearly outside it.
The ranges shown on this site are read directly from the same calibration table the app uses, so the two cannot drift apart. The reference-set medians and typical ranges are shown on each measurement page.
How precise each reading is
No measurement from a photo is exact. Move the camera a little, tilt your head or change the light, and every number shifts slightly. So each reading in your results comes with a 95% measurement margin: a retake in similar conditions usually lands within the value plus or minus that margin.
How the margin is estimated
While it analyses your photo, LookFlex measures it three times, each time running the full chain from landmarks to scores:
- the photo itself;
- its mirror image, with the points mapped back (the same two detections the mirror average uses);
- one retake-like copy, with the camera about 5% closer, the face reframed by 2%, the head tilted 2.5 degrees and the exposure changed by a quarter stop.
A reading's margin is 1.96 times the standard deviation of its three results, the standard way to turn repeated measurements into a 95% range around a single score (Weir, 2005). Re-measuring slightly altered copies of an image has also been used to estimate uncertainty in medical image analysis (Wang et al., 2019); which copies we make, and how many, are our own choices. A margin is never reported below a floor, which is the median margin for that reading across our reference set. The score margins and skin margins are below; each measurement page gives its own.
| Reading | Median margin |
|---|---|
| Glow Score | ±3 |
| Jawline | ±2 |
| Cheekbones | ±1.1 |
| Eyes | ±2 |
| Symmetry | ±1.1 |
| Skin quality | ±4.1 |
| Harmony | ±3.9 |
| Skin: texture | ±2 |
| Skin: evenness | ±1.1 |
| Skin: redness | ±1.1 |
| Skin: under-eye brightness | ±2 |
| Skin: oil balance | ±1.1 |
| Skin: clarity | ±10 |
On the same set, nine in ten faces had a Glow margin of ±7.7 or less. Skin clarity is the least precise reading: spot detection reacts to small shifts in landmarks and contrast, so treat a single clarity number with caution. Each measurement page lists that measurement's median margin, for example ±0.74° for canthal tilt.
Comparing two scans fairly
A difference between two scans counts as a real change only when it is bigger than both margins combined: the square root of the sum of the two squared margins. With two Glow margins of ±3, that is about 4.2 points. This is the 95% smallest detectable change, the usual yardstick when the aim is to track change in one person (Weir, 2005; de Vet et al., 2006). Anything smaller is reported as steady, and a shift in a proportion is reported as a change, never as better or worse.
Each scan also records how it was taken: head angle, how bright the face is, how even the light is from side to side, the colour of the light, focus, how large the face is in the frame (a stand-in for camera distance), expression and the time of day. When two scans differ enough in one of these to move readings by more than their margin, LookFlex marks the readings affected as not comparable instead of calling them better or worse.
We set those limits by editing our reference portraits in controlled ways and finding where each change first moved readings by one margin. Skin readings were the most sensitive: a face about 3% brighter was already enough. Camera distance mattered most for the cheekbone and harmony readings, as you would expect, because a closer camera changes apparent proportions (Ward et al., 2018). Head angle and expression cannot be simulated by editing a photo, so for those LookFlex uses the tolerances of its capture check.
For a fair comparison, scan in the same spot, in the same light, at the same distance, with a relaxed face.
Symmetry
Healthy faces show some left-right asymmetry (Ferrario et al., 1994), so a lower symmetry score describes your face rather than a flaw. Symmetry is also one of the cues studied in attractiveness research: photos edited to be more symmetrical were usually rated more attractive (Perrett et al., 1999), although whether symmetry signals health is much less certain (Rhodes, 2006). LookFlex measures it by pairing each landmark on one side of the face with its mirror partner on the other and comparing both with a midline fitted through your face. It does this for six regions: brows, eyes, cheeks, nose, mouth, jaw. The deviations are expressed as a percentage of face width, so photo size does not matter, and they are weighted by region (the eyes count a little more, brows and cheeks a little less). In our reference set, the middle half of faces scored between 88 and 97.
A deviation becomes a 0 to 100 score along a smooth curve:
| Average deviation | Symmetry score |
|---|---|
| 0% of face width | 100 |
| 1% of face width | 96 |
| 2% of face width | 88 |
| 3% of face width | 80 |
| 5% of face width | 65 |
| 8% of face width | 44 |
| 12% of face width | 26 |
If your head is turned and the 3D correction is not available, LookFlex damps the horizontal part of the comparison and lowers its confidence, because a turned head makes one side look smaller.
Skin analysis, relative to your own baseline
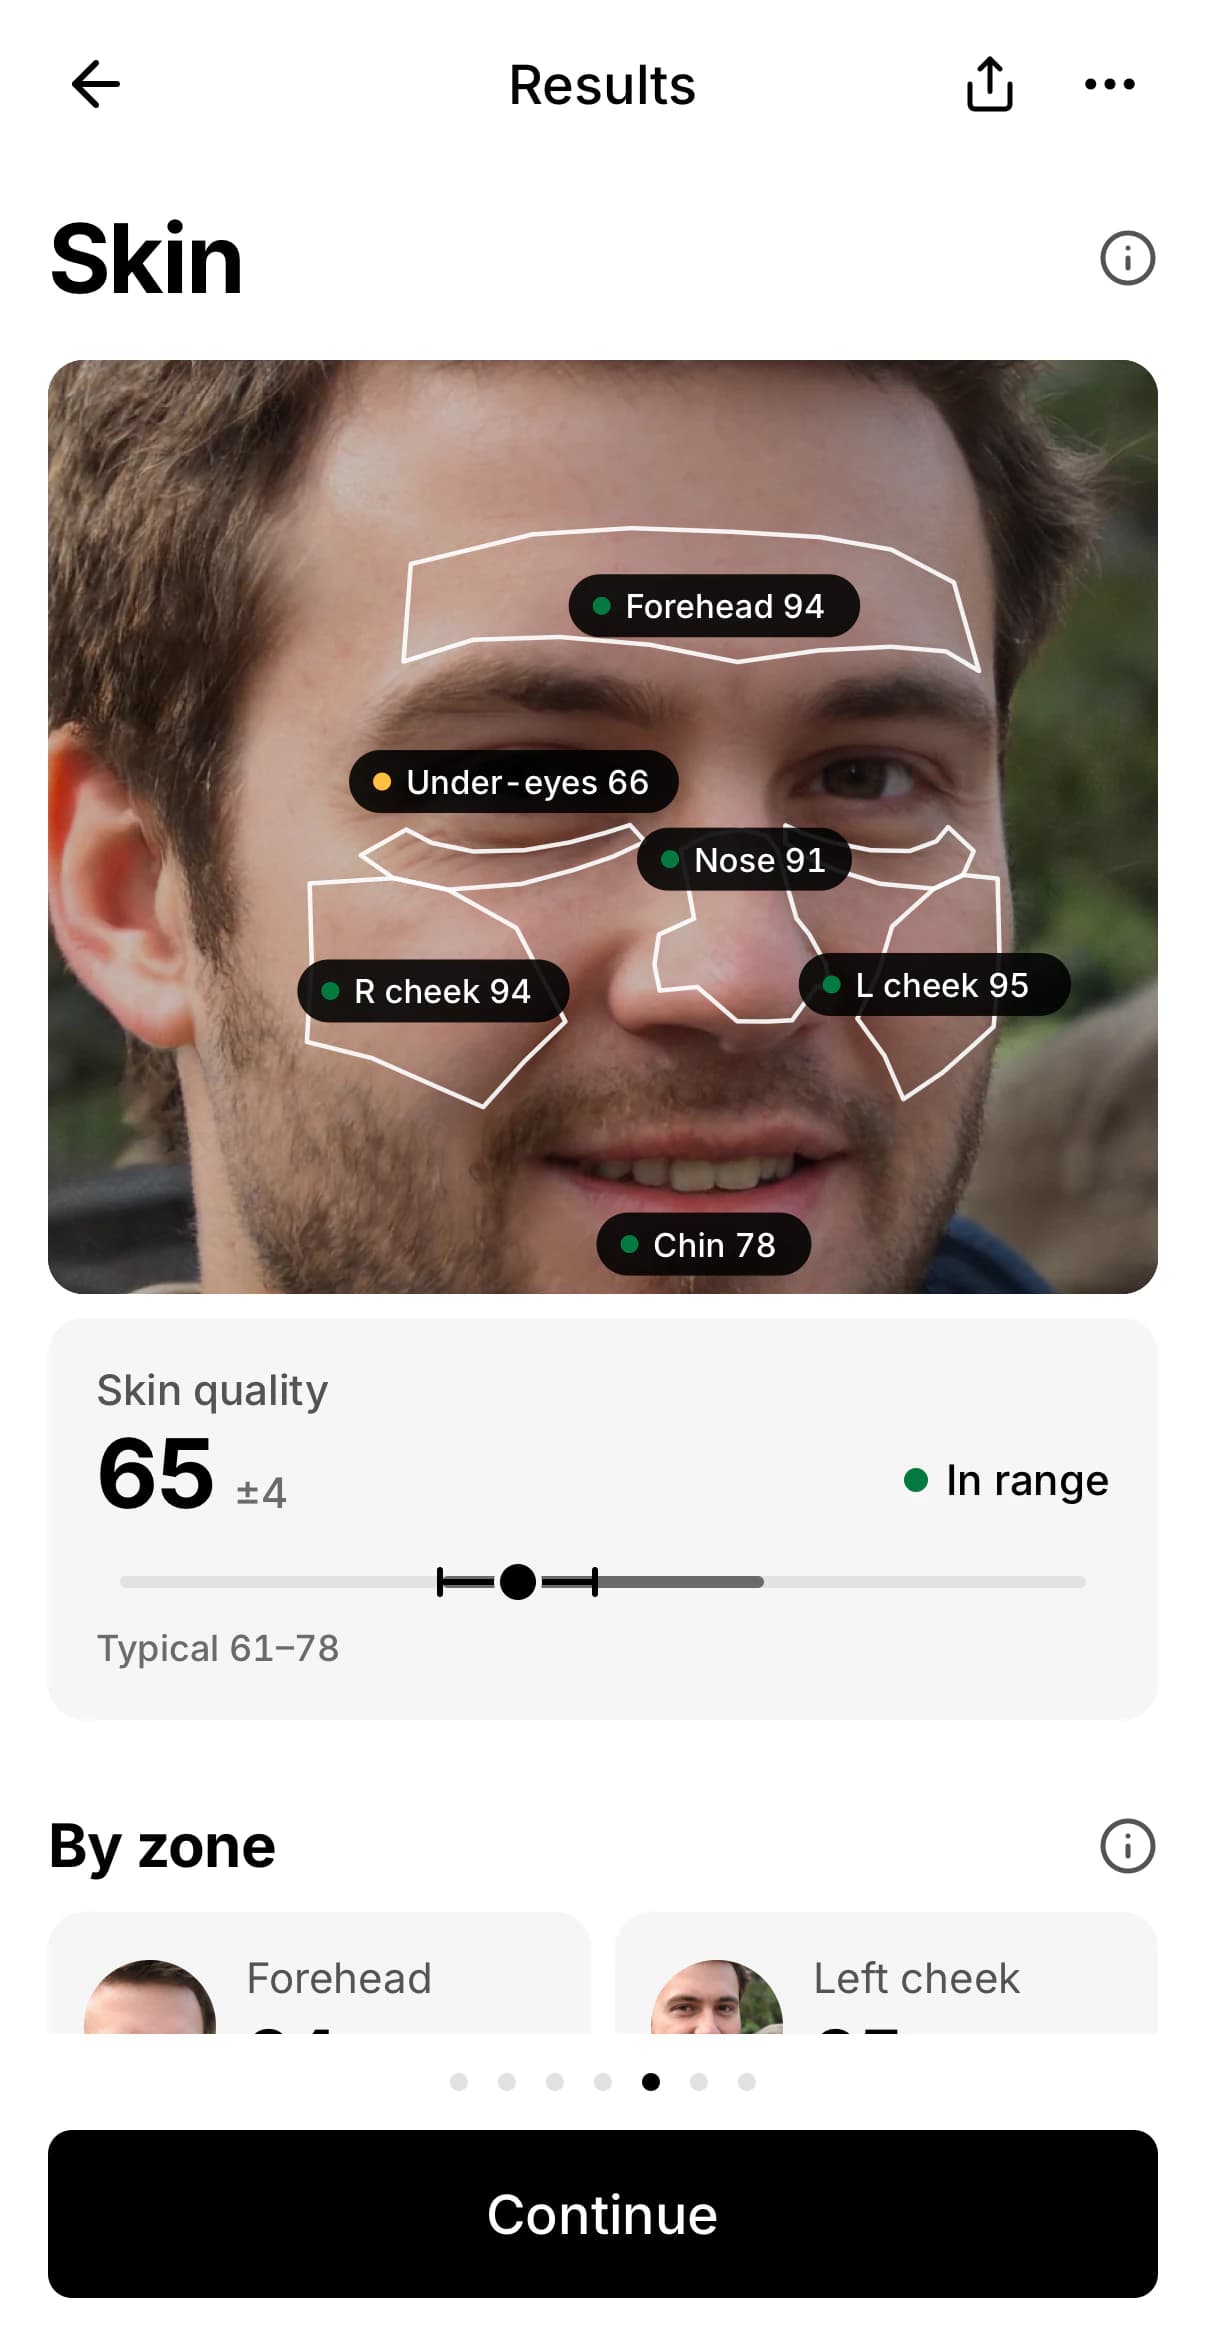
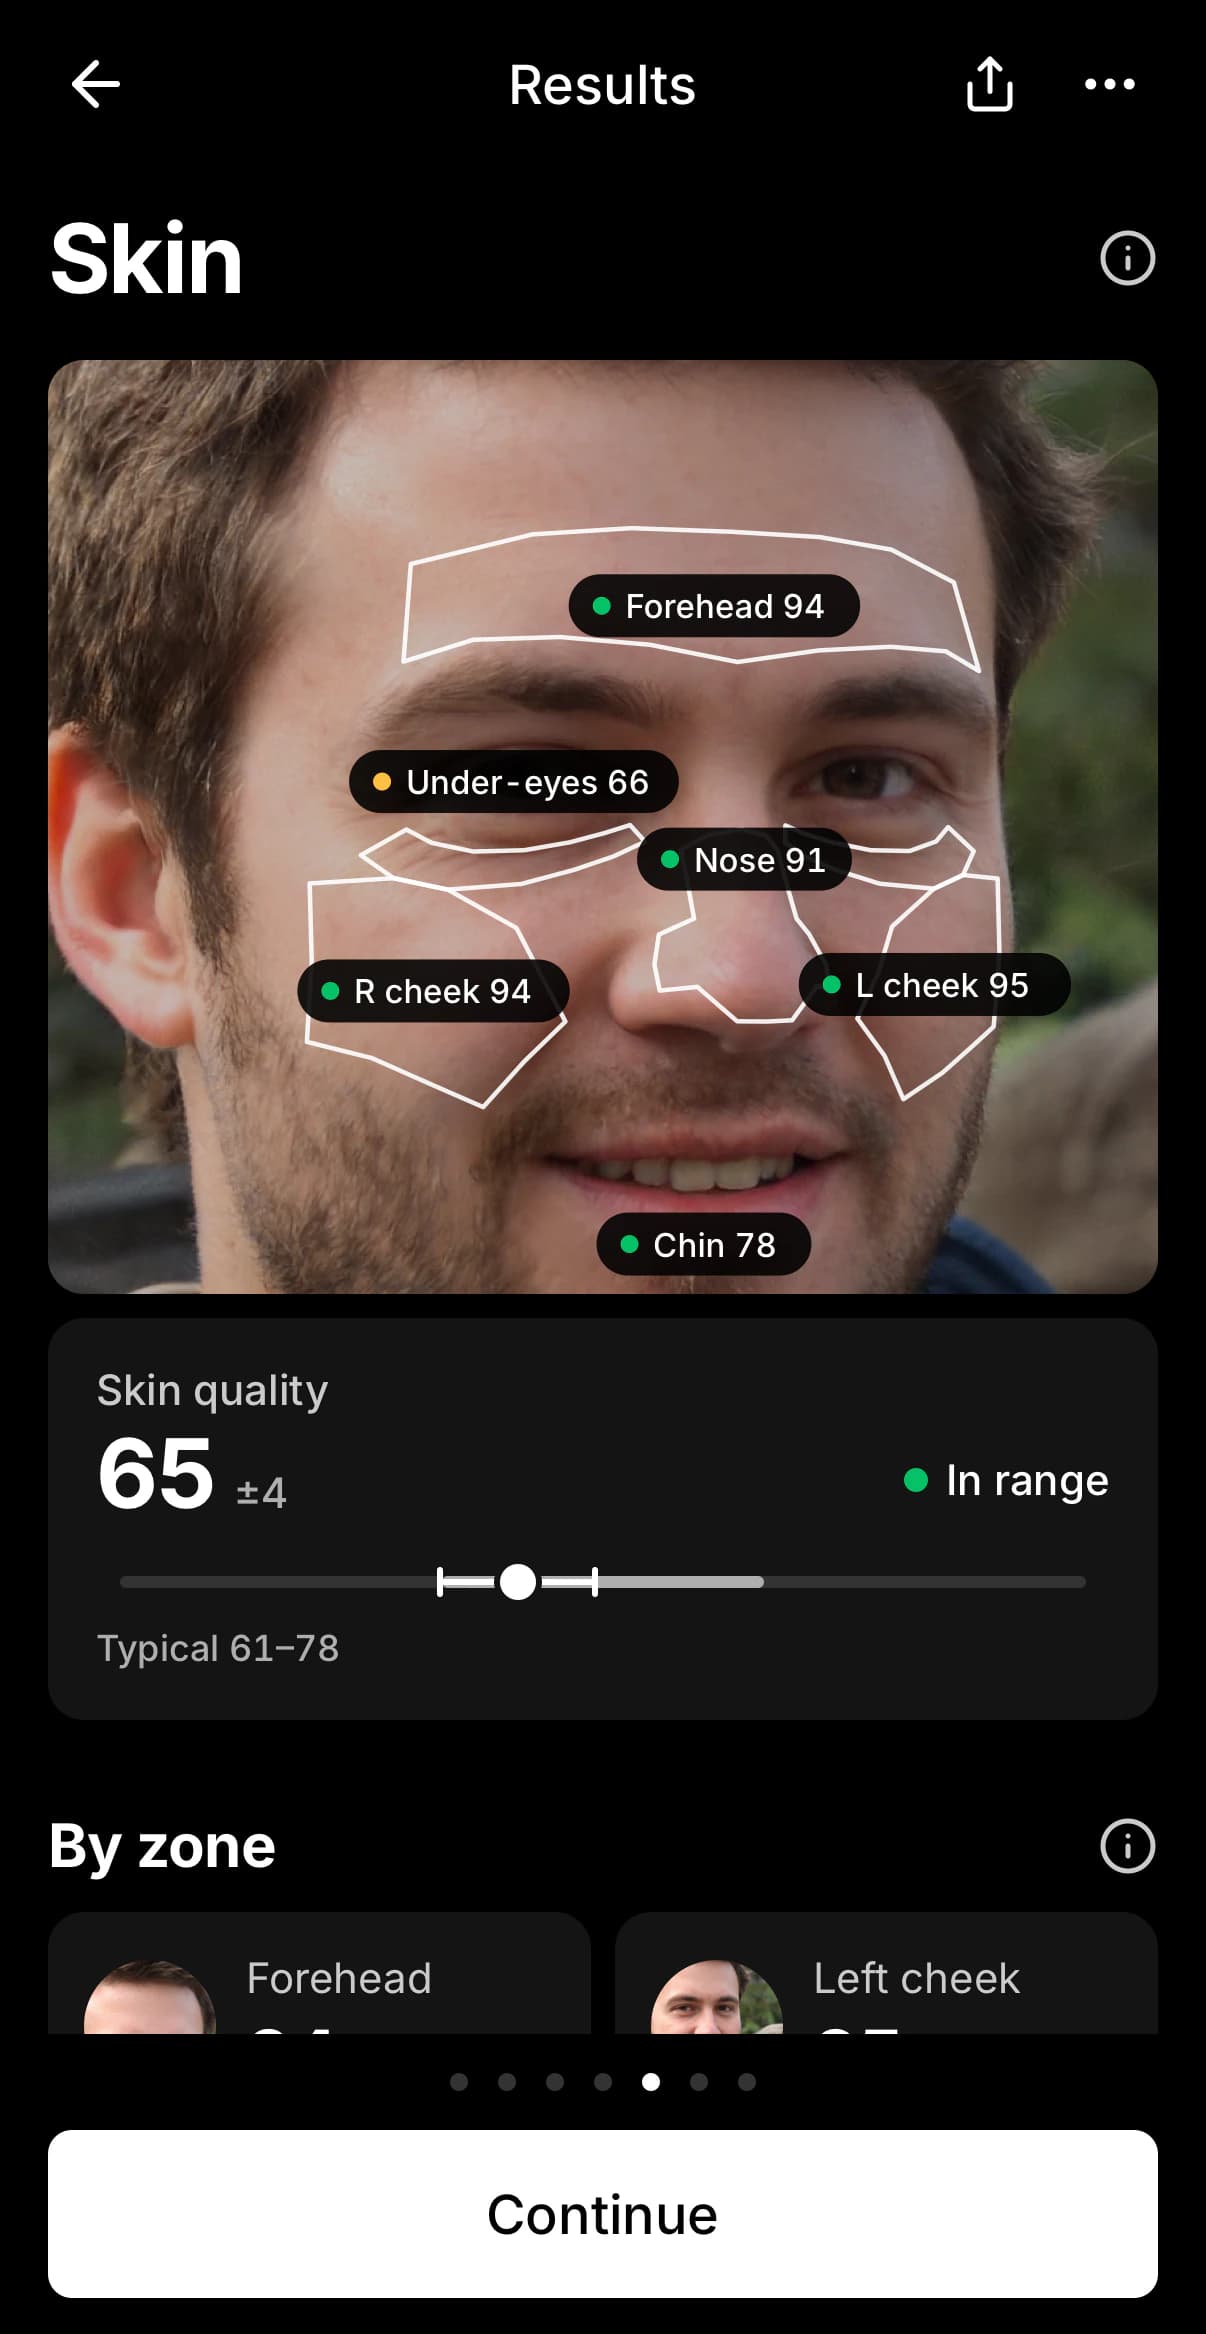
The skin read looks at the pixels inside six zones defined by the landmarks: forehead, left cheek, right cheek, nose, chin and under-eyes. Eyes, brows, lips, nostrils and the shaded creases beside the nose are excluded so that they are not mistaken for skin features. The whole analysis happens on your device. We look at colour evenness, texture, redness and under-eye brightness because research links them to how a face is read: faces with more even skin colouring were judged younger, healthier and more attractive (Fink et al., 2006), texture and colour evenness both changed perceived age and health (Fink & Matts, 2008), added redness and yellowness made faces look healthier (Stephen et al., 2009), and sleep loss darkened the under-eye area (Sundelin et al., 2013).
What it reads
- Clarity. Freedom from spots and blemishes. It counts isolated dark or light blobs above a minimum size and weights them by how strongly they stand out.
- Texture. Smoothness. It measures fine local variation in brightness compared with the surrounding brightness, after removing the camera's sensor noise.
- Evenness. Tone uniformity. It compares small patches against the smooth lighting across the zone.
- Redness. How much redder a zone is than your own median skin colour, allowing for the natural flush of cheeks and nose.
- Under-eye brightness. How much darker the under-eye area is than your own cheek on the same side.
- Oil balance. The share of the T-zone and cheeks that is shiny, with the T-zone weighted more.
Why it is built to be fair across skin tones
This matters because face-analysis systems have been less accurate for some groups. Commercial systems made far more errors on darker-skinned women than on lighter-skinned men (Buolamwini & Gebru, 2018), and a US government test of nearly 200 algorithms found most were less accurate for some age, sex and race groups (Grother et al., 2019). Those studies tested face recognition and gender classification, not skin analysis, so they are a warning and not proof either way. Skin-appearance research has also extended beyond European faces (Tan et al., 2018).
- No signal uses how dark your skin is. Texture, evenness and spots are measured as ratios to the local brightness, so deeper skin is not penalised for being darker.
- Redness is the difference from your own median colour, and the under-eye and shine signals compare one part of your face with another part of your face.
- Camera sensor noise is roughly constant in absolute terms, so it would look like texture on deeper skin. LookFlex estimates it and subtracts it.
- White balance is corrected from the image itself, and every dark or bright decision is made relative to the light falling on that part of the face, so a side-lit cheek is not mistaken for a shadowed or hairy one.
- Hair, beard, deep shadow and bright highlights are masked out before anything is measured.
Each signal is mapped to a 0 to 100 curve anchored on the reference set, so that a typical face scores around 70 to 80 on a signal and only the outer 15% or so raises a concern. The overall skin score combines the signals and is stretched so that the reference median lands around 70. Skin tone itself is never scored and never treated as a concern. Skin readings are also the most sensitive to lighting, so compare them only between scans taken in similar light.
How Glow Score and Potential are computed
Sub-scores
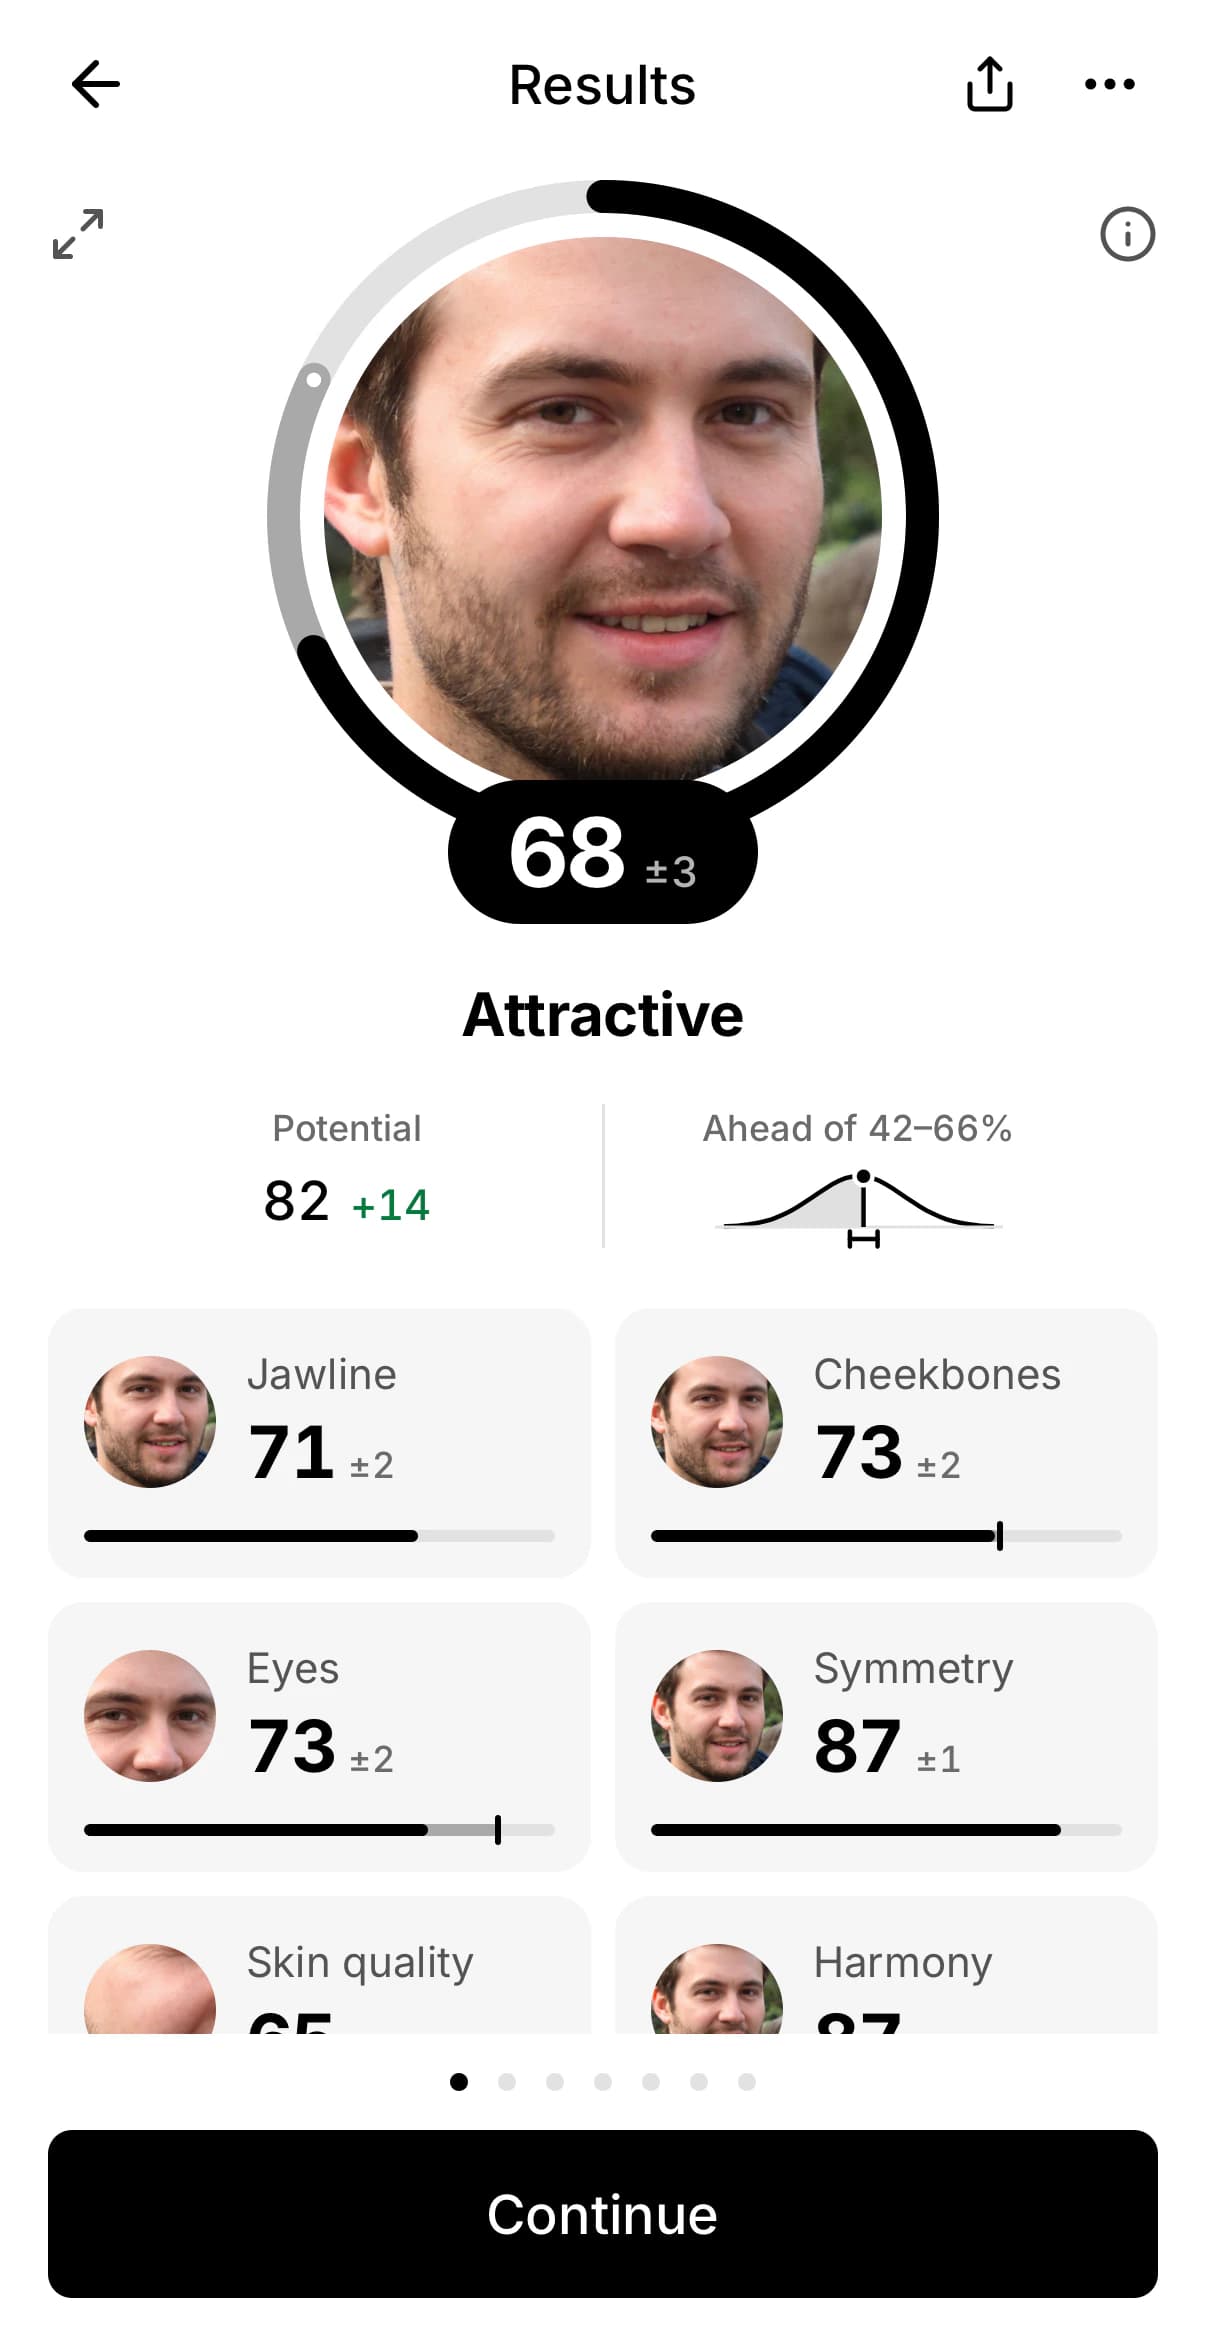
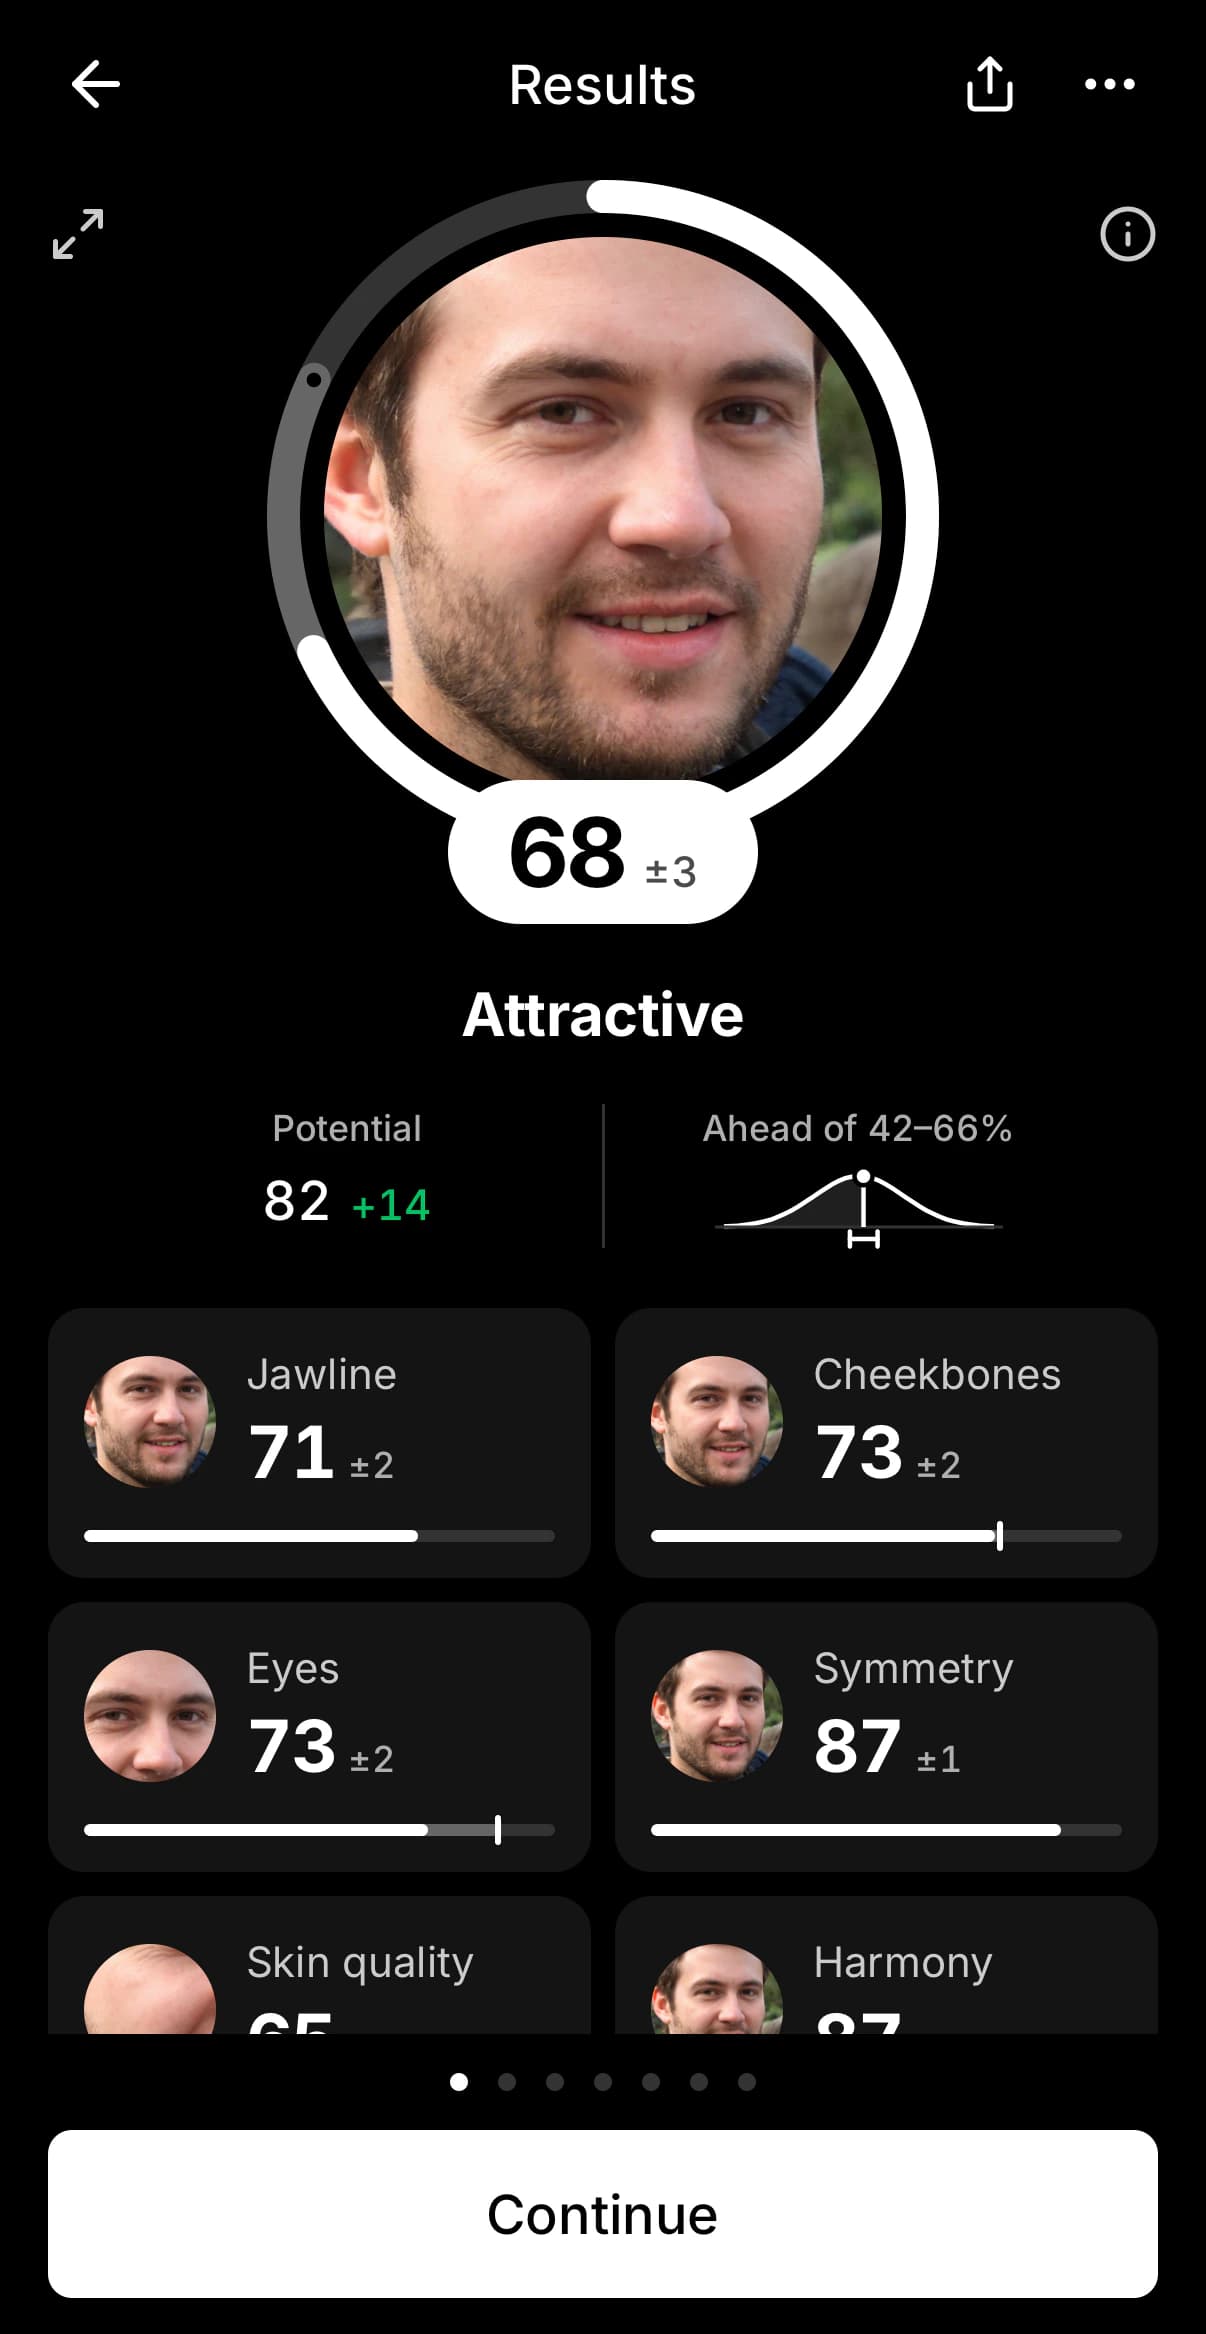
Your results contain six sub-scores. Four come from measurements, one from symmetry and one from skin:
| Sub-score | Inputs and weights |
|---|---|
| Jawline | Jaw definition 45% · Jaw width 20% · Chin-to-philtrum 15% · Jaw symmetry 20% |
| Cheekbones | Cheekbone prominence 55% · Midface ratio 20% · Face width-to-height 15% · Eye-to-face width 10% |
| Eyes | Canthal tilt 30% · Eye spacing 15% · Eye shape 15% · Brow position 15% · Eyes symmetry 10% · Under-eye brightness (skin) 15% |
| Harmony | Eye-to-face width 10% · Face width-to-height 10% · Midface ratio 15% · Facial thirds 15% · Face length-to-width 10% · Nose width 10% · Mouth-to-nose width 10% · Lip balance 10% · Chin-to-philtrum 10% |
| Symmetry | The symmetry score described above. |
| Skin quality | The skin score described above. |
Inside a sub-score, each input counts in proportion to its weight and to its confidence (a low-confidence input counts for between half and all of its weight). The result is then passed through a monotonic curve so that typical faces land in the 60s and 70s and even a perfect set of in-range features tops out around 90. Symmetry and skin are already on this scale.
Glow Score
The Glow Score is a weighted average of the six sub-scores, rescaled by a second curve:
| Sub-score | Weight in Glow Score |
|---|---|
| Harmony | 22% |
| Skin quality | 18% |
| Jawline | 17% |
| Eyes | 17% |
| Symmetry | 14% |
| Cheekbones | 12% |
The weights are our own design choice, not values taken from a study: research supports skin (Fink et al., 2006), symmetry and averageness (Rhodes, 2006) as cues, but it does not say how to weigh them against each other, and individual taste varies (Hönekopp, 2006). The rescaling curve is anchored on the reference set, so that a typical score is in the 60s to low 80s and an exceptional one is 88 or more. These are the anchor points, from the weighted average of sub-scores to the Glow Score (the score is limited to between 25 and 98):
| Weighted average | Glow Score |
|---|---|
| 55 | 40 |
| 66 | 52 |
| 71 | 61 |
| 78.7 | 71 |
| 82.5 | 81.5 |
| 87 | 88 |
| 92 | 93 |
| 100 | 98 |
Tiers are labels over the Glow Score:
- Exceptional: 88 and over
- Striking: 78 and over
- Attractive: 68 and over
- Balanced: 58 and over
- Rising: 45 and over
- Untapped: below the tier above
Percentile, a model estimate
The percentile in your results is a model estimate, not a ranking of real people. We assume Glow Scores follow a bell curve with an average of 67 and a spread of 10. Our reference set is small and skews attractive, so its median Glow of 71 sits near the 66th percentile on that curve rather than the 50th. Your results show the percentile as a range that reflects your Glow margin: a Glow of 71 with a margin of ±3 spans the 54th to 76th percentile. Nothing in it is computed from LookFlex users or any measured population.
Potential
Potential is not a forecast. It is our model's best case: your Glow Score in one defined scenario, run through exactly the same formula that scored your photo:
- Skin quality and under-eye brightness rise to the top 10% of our reference set, its 90th percentile (85 and 98), if they are below it. That is the best level the set shows, which is why Potential is a ceiling and not an expected result. These are the readings daily habits are most likely to move: sun protection and skin-care actives have trial evidence for skin (Hughes et al., 2013; Bissett et al., 2005), and sleep loss visibly darkens the under-eye area (Sundelin et al., 2013).
- For adults, jaw definition and cheekbone prominence rise to the reference median for their sex if they are below it (men 67.1 and 58.9, women 58.3 and 63.9). Both scores partly read facial fat, which tracks body fat (Coetzee et al., 2009; Coetzee et al., 2010). For anyone under 18, or without a profile, they do not move.
- Bone structure, proportions and symmetry never change in the scenario.
A reading already at or above its scenario level stays where it is, so Potential is never lower than your Glow Score. On our reference set, Potential sat a median of 7 points above Glow (the middle half between 5 and 12), and one face of the 45 had no gap at all.
The gain shown for each improvement in your results comes from the same formula: the Glow change if only the readings that habit moves reached their scenario level. Improvements that move the same reading show the same gain, so gains do not add up. The scenario levels are our choice, not a measured result: no study has tested how far or how fast habits move LookFlex's readings, and results depend on consistency, genetics and much that a selfie cannot see.
What the AI layer adds when it is enabled
When the AI analysis is available, LookFlex sends one resized copy of your photo (at most 1024 pixels on the long side) and a summary of your measurements to our server, which forwards them to an AI vision model to answer that single request. Today that is a model from Anthropic. Our server does not keep the image.
The model is given the measured numbers as ground truth and asked to judge only what geometry cannot:
- Skin conditions: acne type and density, post-acne marks, visible pores and texture, redness pattern, pigmentation, under-eye issues and dryness or oiliness.
- Soft tissue: how defined the jawline and cheekbones look, beyond what the landmarks alone can show.
- Hair, brows and facial hair: cut, density, grooming and how they interact with your face shape.
- Presentation: lighting direction, camera distance, expression and anything that biases the read.
It then writes the explanation and suggests strengths and improvements. Its influence is bounded by code, not just by instruction:
- It can shift a sub-score by at most 10 points up or down, and the skin score by between 15 points down and 10 points up. It cannot change a measurement.
- Gains, Potential and timeframes always come from LookFlex's own formula and the cited studies. Sentences in which the AI states its own gains, durations or Potential are removed.
- Its output must match a strict structure and is checked and trimmed before use.
- Advice is limited to levers we can cite or label as guidance: sleep, nutrition, training, sun protection, skincare actives, grooming, hair and posture (the sources are on the research page). Unsafe practices and any guarantee of results are filtered out.
- It never infers or mentions ethnicity, race or ancestry, never calls skin tone or any heritable trait a flaw, and never uses demeaning labels.
- For 16 and 17 year olds, procedures and weight-loss advice are removed entirely, and the advice allows for ongoing facial development.
- It does not diagnose. For anything persistent or concerning it points to a dermatologist or doctor.
If the AI layer is off, unavailable or times out, you still receive a full result from the on-device analysis.
Limitations
- Light. Strong side light, backlight, glare and heavy shadow change the skin read, jaw definition and cheekbone prominence most. Soft, even light from the front is best.
- Angle and distance. A tilted or turned head, a camera held low or high, and a close selfie all distort proportions. In one study a camera held about 30 cm away made the nose look roughly 30% wider than one at 1.5 m (Ward et al., 2018). Pose correction reduces the effect without removing it. Use arm's length or further, with the lens at eye level.
- Expression. Smiles, squints and raised brows move landmarks. Scan with a neutral, relaxed face.
- Coverings. Glasses, fringes over the brows, heavy beards, strong makeup and beauty filters can hide or shift the points being measured.
- A small, synthetic reference set. The ranges and margins come from 45 AI-generated adults. They may not represent every population, age or face, and a reading outside a range is not a flaw.
- Age. The faces of teenagers are still developing, so under-18 results may be less stable. They also carry stricter advice rules.
- One photo is one photo. Margins show how far a reading can move between similar photos. Compare scans taken in similar conditions, and read the trend rather than any single number.
- Not a beauty authority. Raters often agree on who looks attractive, including across cultures (Langlois et al., 2000), yet individual taste counted about as much as shared taste in one study (Hönekopp, 2006) and is shaped mostly by personal experience (Germine et al., 2015). The ranges describe a calibrated convention, not objective beauty, health or worth.
- Not medical. LookFlex does not diagnose, treat or screen for any condition. See the medical disclaimer.
Privacy by design
- The landmark detection, measurements, symmetry, face shape and skin read run on your device.
- Your photos and results are stored on your iPhone, in the app's own storage. You do not need an account to scan.
- A photo reaches our servers only if you use a feature that needs AI, as a resized copy for that single request. We do not store it.
- We do not infer ethnicity or race.
Face geometry can count as biometric data in some places, such as Illinois and the European Union, and some jurisdictions treat certain facial and skin information as health-related data. Read exactly what we collect and why in the privacy policy, the biometric data notice and the consumer health data notice.
Validation and what comes next
The next step is to test the measurements, margins and ranges on a broad set of real selfies, covering a range of skin tones, ages, sexes and lighting conditions, including repeat photos of the same people to check that the margins hold, plus live-camera tests on real phones. Where the results show a measurement behaves unfairly or unreliably, we will change the engine or the ranges, and this site will change with them because it reads from the same tables.
The studies we rely on for the claims on this site, and how we verified them, are on the research page. None of them tests LookFlex itself.
Found something that looks wrong, or want to challenge a number? Write to [email protected]. Include the measurement and, if you are comfortable, the conditions of the photo. We read every report.
Frequently asked questions
Does LookFlex upload my photo to analyse it?
The landmark detection, the 16 measurements, symmetry, face shape and the skin read all run on your device. Your photo is sent to our server only when the optional AI analysis (or another AI feature) is used, as a resized copy that is forwarded to an AI provider to answer that one request. Our servers do not store it.
How precise are the measurements?
Every reading comes with a 95% measurement margin: a retake in similar conditions usually lands within the value plus or minus that margin. LookFlex measures each photo three times (the photo, its mirror image and one slightly reframed, tilted and re-exposed copy) and takes 1.96 times the spread of the results, a standard way to turn repeated measurements into a range. On our 45 reference portraits the median Glow Score margin was ±3 points, and nine in ten faces had ±7.7 or less. The margins cover small changes in framing, tilt and exposure only. A different head angle, expression or light direction can move readings further, and the margins were measured on AI-generated portraits, so repeatability on real retakes is still being tested.
When is a change between two scans real?
When it is bigger than the two scans' margins combined: the square root of the sum of their squared margins, which is the 95% smallest detectable change. With two Glow margins of ±3, a change has to exceed about 4.2 points. If the photos were taken in clearly different light, angle, distance or expression, LookFlex marks the readings affected as not comparable instead of calling them better or worse.
Why were the ranges tuned on AI-generated faces?
They give a controlled set of adult portraits with no privacy issues for the people in them, which was the practical starting point. The drawback is real: the set is small (45 faces), attractive-skewed and not a random sample of people. That is why we say so, and why validation on real selfies across skin tones and lighting is under way.
Is the skin analysis fair across skin tones?
It is designed to be. No skin signal uses absolute darkness. Each one compares your skin with your own colour and brightness, or compares one zone of your face with another, and sensor noise is estimated and removed so it does not read as texture on deeper skin. Design is not proof, so we are checking this on real photographs across skin tones before we make stronger claims.
Is the Glow Score a measure of how attractive I am?
No. It is our model: a weighted summary of how closely your measurements sit to LookFlex's scoring ranges, plus symmetry and a skin score. Attractiveness depends on expression, personality, personal taste and much else that a photo cannot show; in research, individual taste counted about as much as shared taste (see our research page). Use the score to track change and to decide what to work on.
What is Potential?
Potential is our model's best case: your Glow Score if your skin and under-eye readings reached the top 10% of our reference set and, for adults, jaw and cheekbone definition reached its median, with bone structure unchanged. It runs through the same formula that scored your photo. It is a what-if, not a forecast: no study has tested how far or how fast habits move LookFlex's readings.
What does the percentile mean?
It is a model estimate, not a ranking of real people. We assume Glow Scores follow a bell curve with an average of 67 and a spread of 10, and your results show the percentile as a range that reflects your Glow margin. It is not computed from LookFlex users or any measured population.
Can LookFlex tell my ethnicity or age from my face?
No, and it is built not to. The measurements are proportions, the skin read is relative to your own baseline, and the AI layer is instructed never to infer or mention ethnicity, race or ancestry, or to treat a heritable feature such as skin tone or eyelid shape as a flaw. You tell LookFlex your sex and age bracket in setup.
Is this medical advice?
No. LookFlex describes proportions and visible skin characteristics for grooming and habit planning. It does not diagnose anything. See a doctor or dermatologist for persistent, painful or changing skin, or any health concern.
References
Every DOI was checked against Crossref. The evidence label says how much weight a source can carry alone. See how we choose sources on the research page.
- Bashour M, Geist C (2007). Is medial canthal tilt a powerful cue for facial attractiveness?. Ophthalmic Plastic and Reconstructive Surgery. doi:10.1097/IOP.0b013e31802dd7dcLimited evidenceExperiment
- Bissett DL, Oblong JE, Berge CA (2005). Niacinamide: a B vitamin that improves aging facial skin appearance. Dermatologic Surgery. doi:10.1111/j.1524-4725.2005.31732Moderate evidenceRandomised trial
- Buolamwini J, Gebru T (2018). Gender shades: intersectional accuracy disparities in commercial gender classification. Proceedings of Machine Learning Research. SourceModerate evidenceMethod or technical report
- Coetzee V, Chen J, Perrett DI, Stephen ID (2010). Deciphering faces: quantifiable visual cues to weight. Perception. doi:10.1068/p6560Moderate evidenceCross-sectional study
- Coetzee V, Perrett DI, Stephen ID (2009). Facial adiposity: a cue to health?. Perception. doi:10.1068/p6423Moderate evidenceCross-sectional study
- de Vet HCW, Terwee CB, Knol DL, Bouter LM (2006). When to use agreement versus reliability measures. Journal of Clinical Epidemiology. doi:10.1016/j.jclinepi.2005.10.015Strong evidenceMethod or technical report
- Ferrario VF, Sforza C, Poggio CE, Tartaglia G (1994). Distance from symmetry: a three-dimensional evaluation of facial asymmetry. Journal of Oral and Maxillofacial Surgery. doi:10.1016/0278-2391(94)90528-2Limited evidenceCross-sectional study
- Fink B, Grammer K, Matts PJ (2006). Visible skin color distribution plays a role in the perception of age, attractiveness, and health in female faces. Evolution and Human Behavior. doi:10.1016/j.evolhumbehav.2006.08.007Moderate evidenceExperiment
- Fink B, Matts PJ (2008). The effects of skin colour distribution and topography cues on the perception of female facial age and health. Journal of the European Academy of Dermatology and Venereology. doi:10.1111/j.1468-3083.2007.02512.xModerate evidenceExperiment
- Germine L, Russell R, Bronstad PM, et al. (2015). Individual aesthetic preferences for faces are shaped mostly by environments, not genes. Current Biology. doi:10.1016/j.cub.2015.08.048Moderate evidenceCross-sectional study
- Grother P, Ngan M, Hanaoka K (2019). Face recognition vendor test part 3: demographic effects. NIST Interagency Report 8280. doi:10.6028/NIST.IR.8280Strong evidenceMethod or technical report
- Hönekopp J (2006). Once more: is beauty in the eye of the beholder? Relative contributions of private and shared taste to judgments of facial attractiveness. Journal of Experimental Psychology: Human Perception and Performance. doi:10.1037/0096-1523.32.2.199Moderate evidenceExperiment
- Hughes MCB, Williams GM, Baker P, Green AC (2013). Sunscreen and prevention of skin aging: a randomized trial. Annals of Internal Medicine. doi:10.7326/0003-4819-158-11-201306040-00002Strong evidenceRandomised trial
- Kartynnik Y, Ablavatski A, Grishchenko I, Grundmann M (2019). Real-time facial surface geometry from monocular video on mobile GPUs. arXiv. SourceModerate evidenceMethod or technical report
- Langlois JH, Kalakanis L, Rubenstein AJ, et al. (2000). Maxims or myths of beauty? A meta-analytic and theoretical review. Psychological Bulletin. doi:10.1037/0033-2909.126.3.390Strong evidenceMeta-analysis
- Perrett DI, Burt DM, Penton-Voak IS, et al. (1999). Symmetry and human facial attractiveness. Evolution and Human Behavior. doi:10.1016/S1090-5138(99)00014-8Moderate evidenceExperiment
- Rhodes G (2006). The evolutionary psychology of facial beauty. Annual Review of Psychology. doi:10.1146/annurev.psych.57.102904.190208Strong evidenceReview
- Stephen ID, Law Smith MJ, Stirrat MR, Perrett DI (2009). Facial skin coloration affects perceived health of human faces. International Journal of Primatology. doi:10.1007/s10764-009-9380-zModerate evidenceExperiment
- Sundelin T, Lekander M, Kecklund G, et al. (2013). Cues of fatigue: effects of sleep deprivation on facial appearance. Sleep. doi:10.5665/sleep.2964Moderate evidenceExperiment
- Tan KW, Tiddeman B, Stephen ID (2018). Skin texture and colour predict perceived health in Asian faces. Evolution and Human Behavior. doi:10.1016/j.evolhumbehav.2018.02.003Moderate evidenceExperiment
- Wang G, Li W, Aertsen M, et al. (2019). Aleatoric uncertainty estimation with test-time augmentation for medical image segmentation with convolutional neural networks. Neurocomputing. doi:10.1016/j.neucom.2019.01.103Limited evidenceMethod or technical report
- Ward B, Ward M, Fried O, Paskhover B (2018). Nasal distortion in short-distance photographs: the selfie effect. JAMA Facial Plastic Surgery. doi:10.1001/jamafacial.2018.0009Moderate evidenceMethod or technical report
- Weir JP (2005). Quantifying test-retest reliability using the intraclass correlation coefficient and the SEM. Journal of Strength and Conditioning Research. doi:10.1519/15184.1Strong evidenceMethod or technical report
Explore the details: all 16 measurements and the seven face shapes.
Start with a baseline
Answer a few questions and take one photo. Your first scan is free.